In the immediate aftermath of the 2010 UK General Election, there was a lot of talk about whether any party won and which party or parties lost. Labour’s stock line was that nobody won. The Conservatives focused on the fact that Labour had lost. Amidst the sorcery of spin, I, like many people, may have paid little attention to just how many other political parties lost that election. In point of fact, most of them lost. That much is inevitable when you have a lot more than two parties participating in a so-called two-party system. So recently I dug out the data and tried to understand who lost and by how much.
To begin with, let us calibrate the electoral battlefield. In the 2010 General Election, there were a total of 4,145 candidates that stood in the 649 seats that were contested on the day. Between them, they received 29,883,627 votes. That means the mean was 7,210 votes. The median was just over 3,000 votes. The popularity prize went to Stephen Timms of Labour, who secured a whopping 35,471 votes to retain his constituency of East Ham. Nobody else got over 34,000 votes. That is not bad at all, considering that a legion of dark warriors from the digital arena were supposedly up in arms about the Digital Economy Act that Timms steered through Parliament. At the other end of the scale came Godfrey Spickernell, the sole candidate of the Blue Environment Party (think of a kind of ‘Tory Save the Earth’ and not ‘Muddy Waters Piped Music For All’). Godfrey registered 17 votes in Chelsea and Fulham. You could call that a hosing from the blue rinse brigade. Though it is technically possible to receive no votes, it takes 10 electors in the constituency to nominate a candidate, implying Godfrey Spickernell did well just to get his name on the ballot paper.
Further calibration reveals that treating all constituencies as the same is fraught with danger, thanks to the absurdly uneven combination of effects created by first past the post politics and the uneven way boundaries are drawn. The Outer Hebrides constituency of Na h-Eileanan an Iar has a fifth the number of voters of the Isle of Wight, yet both have exactly one MP. As a consequence, the sitting MP in Na h-Eileanan an Iar, the SNP’s Angus MacNeil, retained his seat with a majority of 12.8% despite polling only 6,723 votes. Contrast that with the result obtained by Conservative candidate Annunziata Rees-Mogg in the constituency of Somerton and Frome. The 26,976 votes she received ranked her 101st of all candidates standing in the General Election, but she came 2nd in Somerton and Frome and so lost to David Heath of the Liberal Democrats.
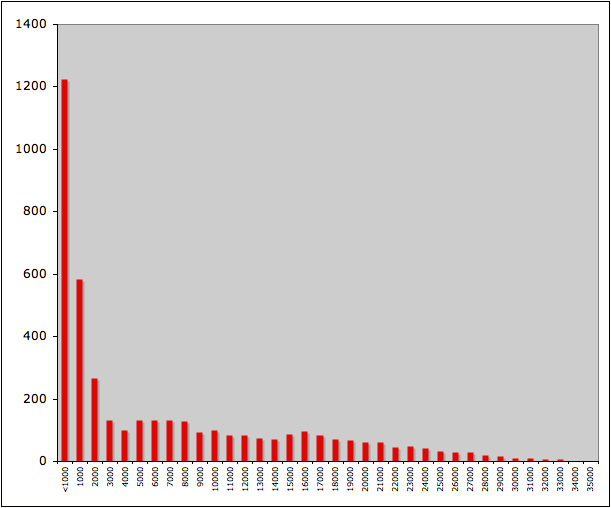
Ignoring parties and just looking at how votes are spread, we see that, not surprisingly, most candidates are at the bottom end of the scale. In this graph, the x-axis represents 1,000-vote bands (0 to 999 votes, and so on) and the y-axis is the number of candidates whose vote count fell into that band.

29.6% of candidates secured less than a thousand votes. 29.6% candidates received 10,000 votes or more. There is hence an unexpected symmetry between the 1,225 candidates who failed to break the 1,000-vote mark and the 1,227 candidates who succeeded in breaking 10,000 votes.
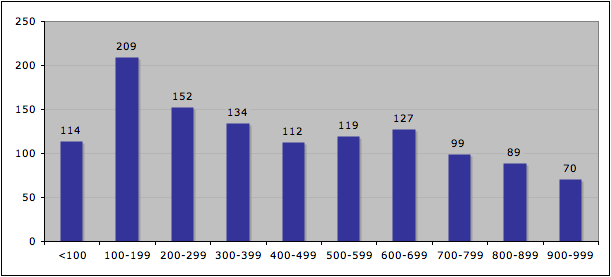
Focusing only on the candidates who scored less than 1,000, you might expect a similar skew with most candidates winning next to no votes and relatively few in the 900-999 band. As this next diagram shows, at the low end of the scale the distribution of performances is actually quite even. This graph shows how many candidates scored between 0 and 99 votes, 100 to 199 etc.

Only the bottom 114 candidates (2.75%) received fewer than a hundred votes and only 7.8% of candidates fell below 200 votes. This rather implies that any decent candidate should be able to find a few hundred people to vote for them, no matter which constituency they fight and no matter what cause they support. That much is underlined by the performance of Britain’s best loved novelty party, the Monster Raving Loonies, who enjoyed a positive 0.02% swing to take their total to 7,510 votes across the 27 seats they contested, giving them an average of 278 votes per seat. Other comedy candidacies included the Fancy Dress Party in Dartford (207 votes, 0.4%) and perennial favourite Captain Beany of the New Millennium Bean Party, whose 558 votes in Aberavon was enough to beat the official UKIP candidate. However, the seemingly serious aims of the Magna Carta party failed to connect with voters, and they managed just 112 votes across the 3 seats they fought. In contrast, a candidate who changed his name by deed poll managed to secure 155 votes in Leeds Central, despite not going to the trouble to set up a party or provide any kind of official description of what he stood for. Voters must have correctly guessed that Mr. We Beat The Scum One-Nil was proud of his local football team’s victory over Manchester United in the FA Cup.
Candidates who beat the median of 3,000 votes all did well enough to retain their deposits. A few years ago, some consideration was given to lowering the current 5% threshold for retaining a candidate’s deposit. If the threshold had been just 1% in the 2010 General Election, then 729 candidates (17.6%) would still have lost their deposits. A number of parties in this election who lost all their deposits at the current 5% threshold would have been greatly helped by reducing the threshold to 1%. Those partis include: the last vestiges of the Social Democrats (the ones who refused to merge with the Lib Dems) who averaged 776 votes in the two seats they fought; the National Front, who did better than 1% in 9 of the 17 seats they contested; the Cornish party Mebyon Kernow, who polled above 1% in 5 of the 6 seats they fought, and the English Democrats, who would have saved nearly half their deposits from the 107 seats they contested.
If we count parties as separate if they use a different name e.g. Labour and Labour Co-Op, then a total 34 political parties fielded four or more candidates in the 2010 General Election. Between them they put up 3,683 candidates, or a little under 89% of all the candidates that stood. 16 of those parties secured over 1,000 votes on average, including the BNP (564,321 votes across 338 seats) and the almost-forgotten Liberal Party (5,363 votes across 4 seats). On the flipside, 7 parties failed to beat the Loony average of 278 votes per seat. They were as follows:
– The Alliance for Green Socialism polled 264 votes for each of the 6 seats they contested. Clearly they need a bigger alliance. It is unknown if they are willing to agree a pact with the Blue Environment Party to form the Cyan Coalition.
– The Christian Party fought 70 seats and took 262 votes on average. God moves in mysterious ways, but clearly chose not to swing this election.
– The Communist Party of Britain took 178 votes on average over 4 seats. It is unknown how much their support for Labour and other socialist candidates made a difference to the final vote tallies elsewhere.
– The Animal Protection Party averaged 169 votes over 4 seats. At this rate, they are in danger of becoming extinct.
– The Pirate Party fought 9 seats and secured 150 votes per seat. They are hopeful that others will copy their policies if not their campaign tactics.
– The Trots of the Workers’ Revolutionary Party averaged 105 votes across the 7 seats they fought. When asked if factionalism was an obstacle to the success of far-left parties, they instead blamed the Zionist conspirators behind the People’s Front of Judea.
– The pro-zombie party, Citizens for Undead Rights and Equality (CURE) managed 79 votes on average, across 4 constituencies. However, they clearly suffered from blatant discrimination; had the undead been allowed to vote, chances are that CURE would have done a lot better.

Be the first to comment